


This winter semester, we had the following three AMOS projects at TU Berlin:
- Conversational chatbots
- Side window entertainment
- Pretendr (big data analytics)
Below, please find the project summaries as articulated by the student teams.
Conversational chatbots
| Project name | Conversational chatbots |
|---|---|
| Project mission | The mission of the project is to help team leaders and/or teams choose the most suitable agile method for their team by informing them about agile methods. |
| Industry partner | Actano GmbH |
| Team logo |  |
| Project summary | The chatbot was developed as an API, which is used by the Workstreams Slack app developed by Actano. The chatbot is able to converse with the user about the Scrum and Kanban agile methods. It guides the user though each topic by giving him brief overview of the terminology used in those processes. The bot is able to remember all previous conversation with each user and is able to handle different sessions. The user can interact with the bot by either asking him things directly or by using the button functionality that is integrated in Slack. |
| Project illustration | 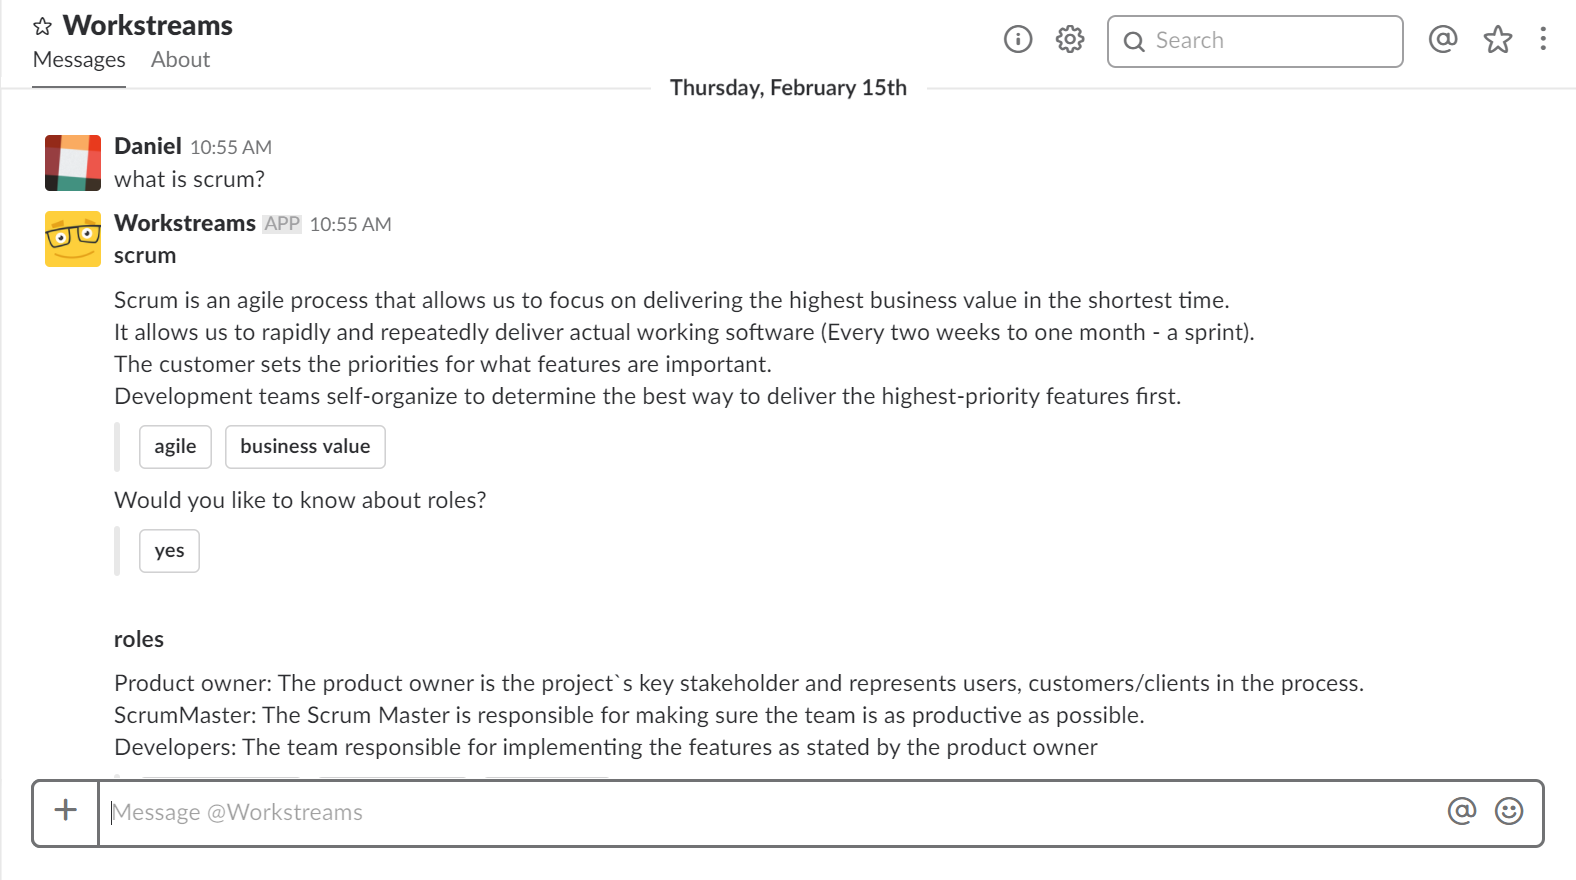 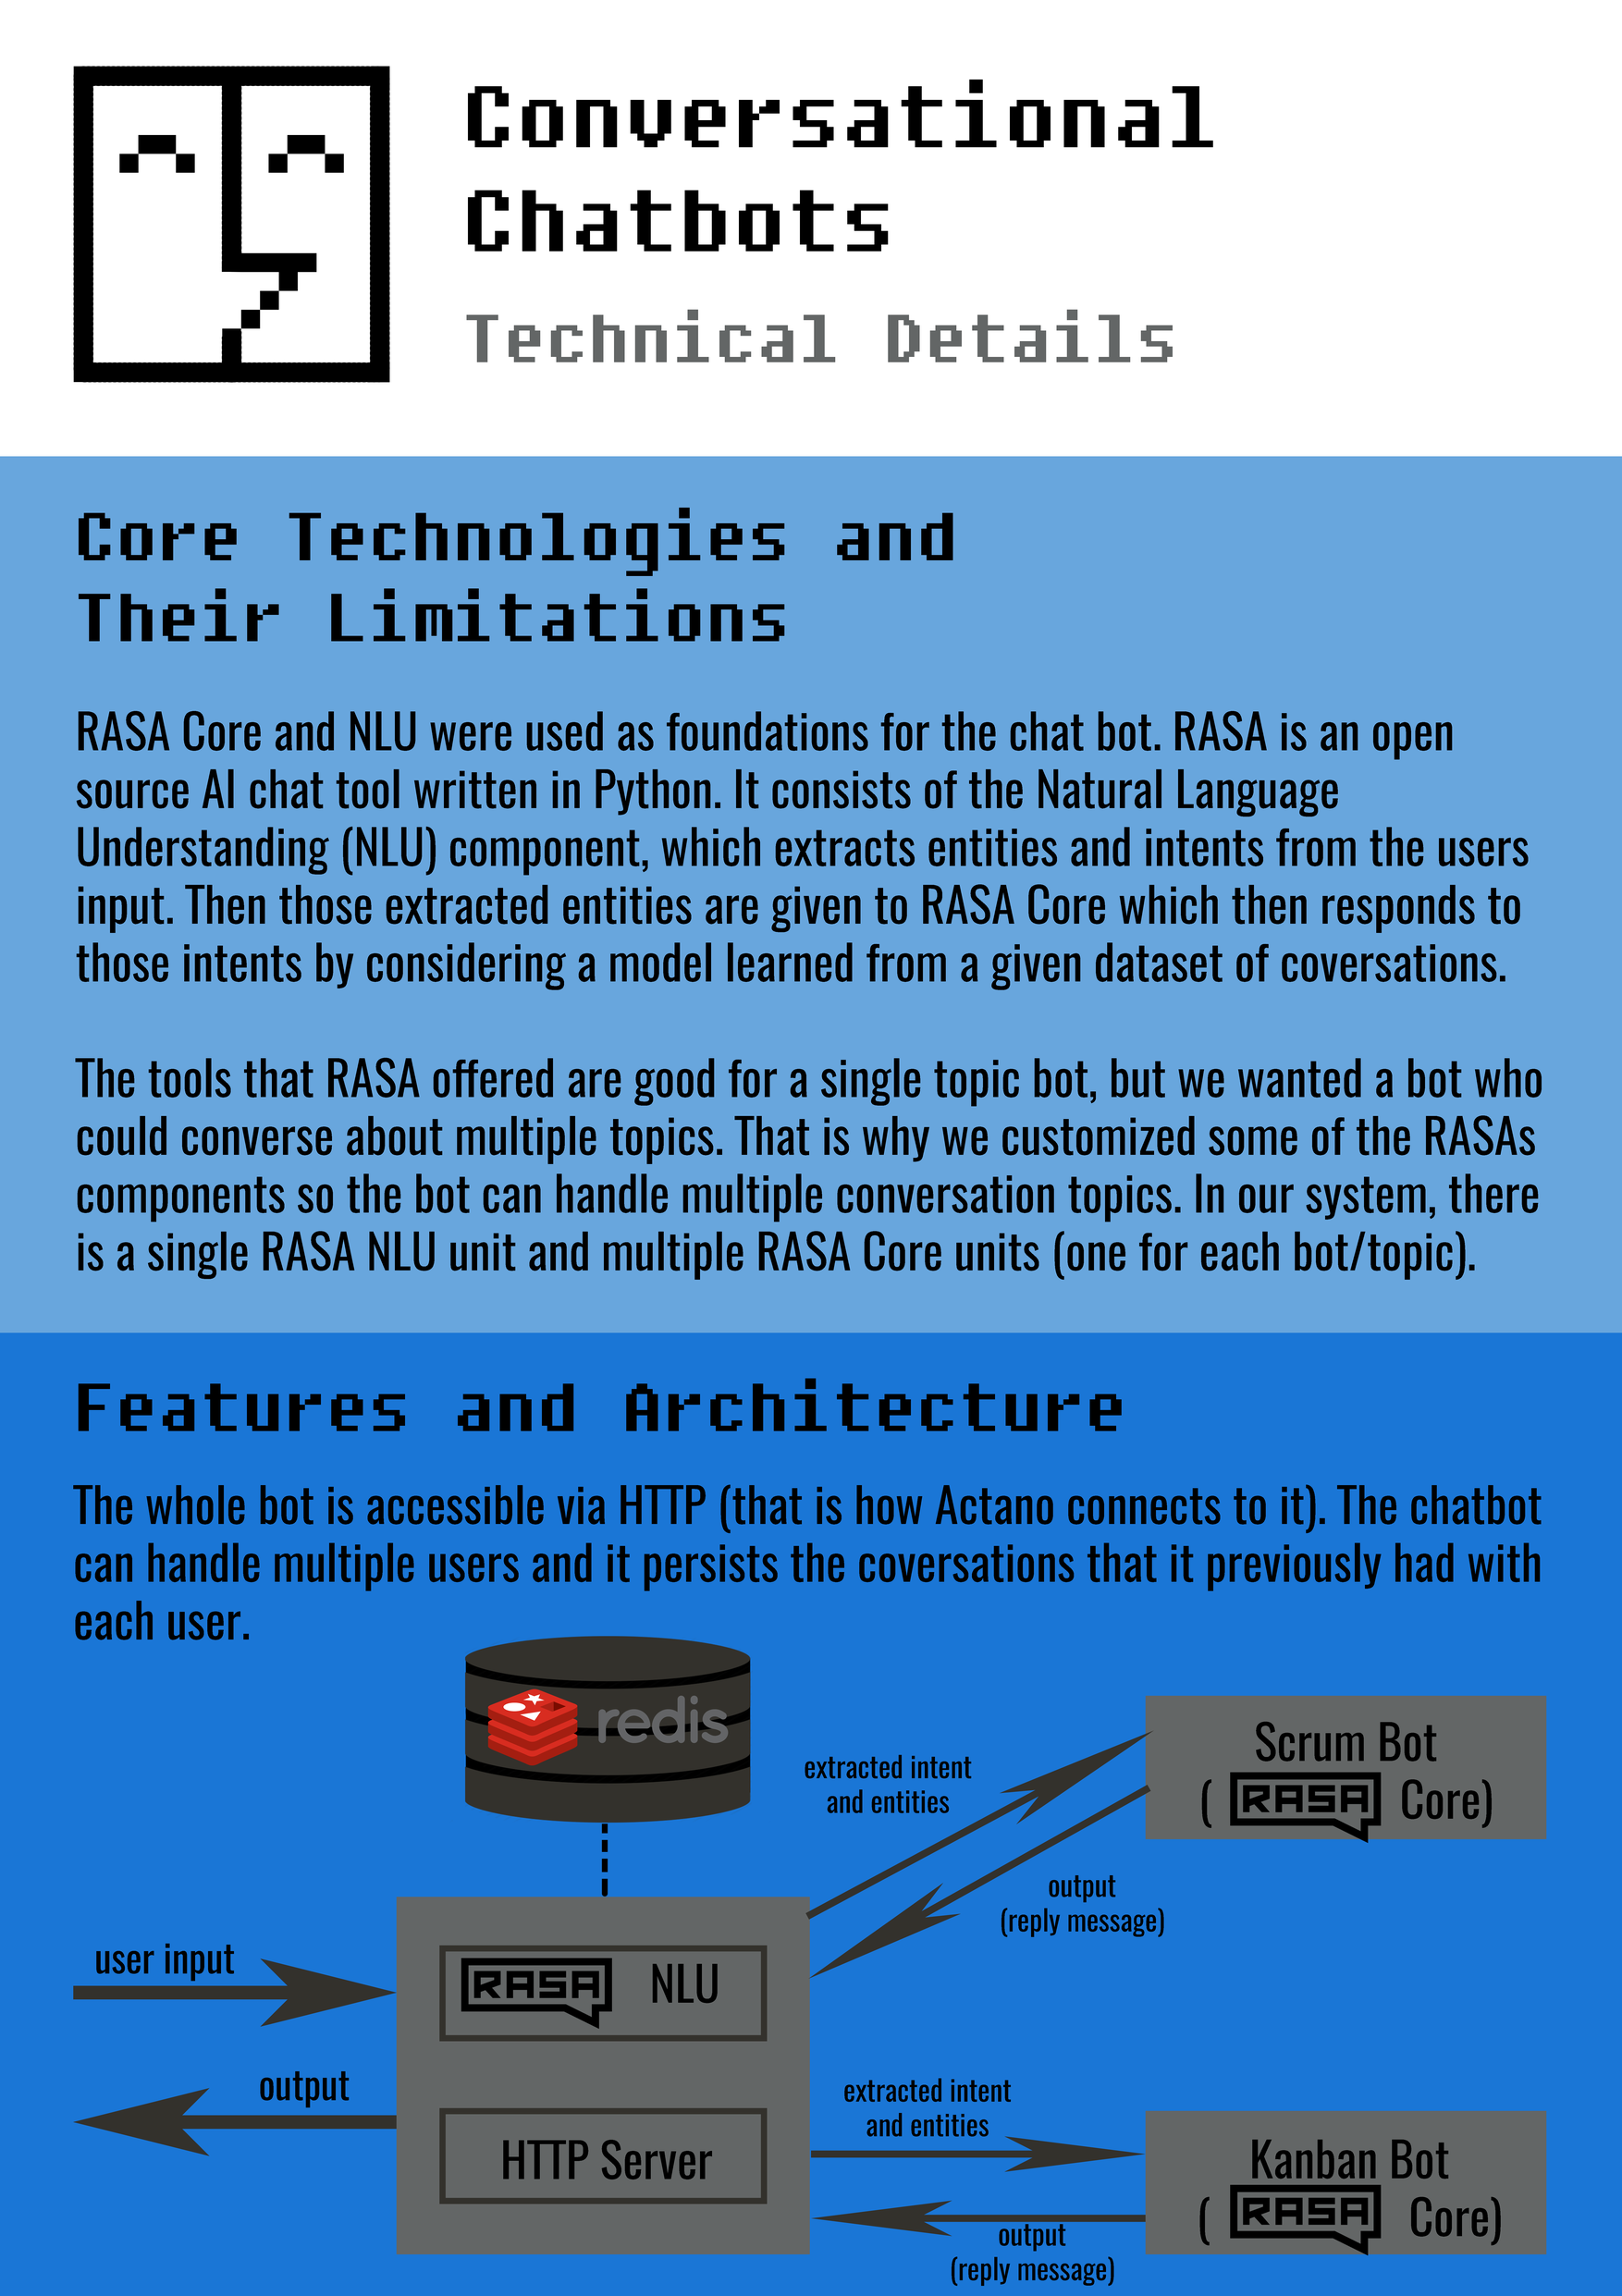 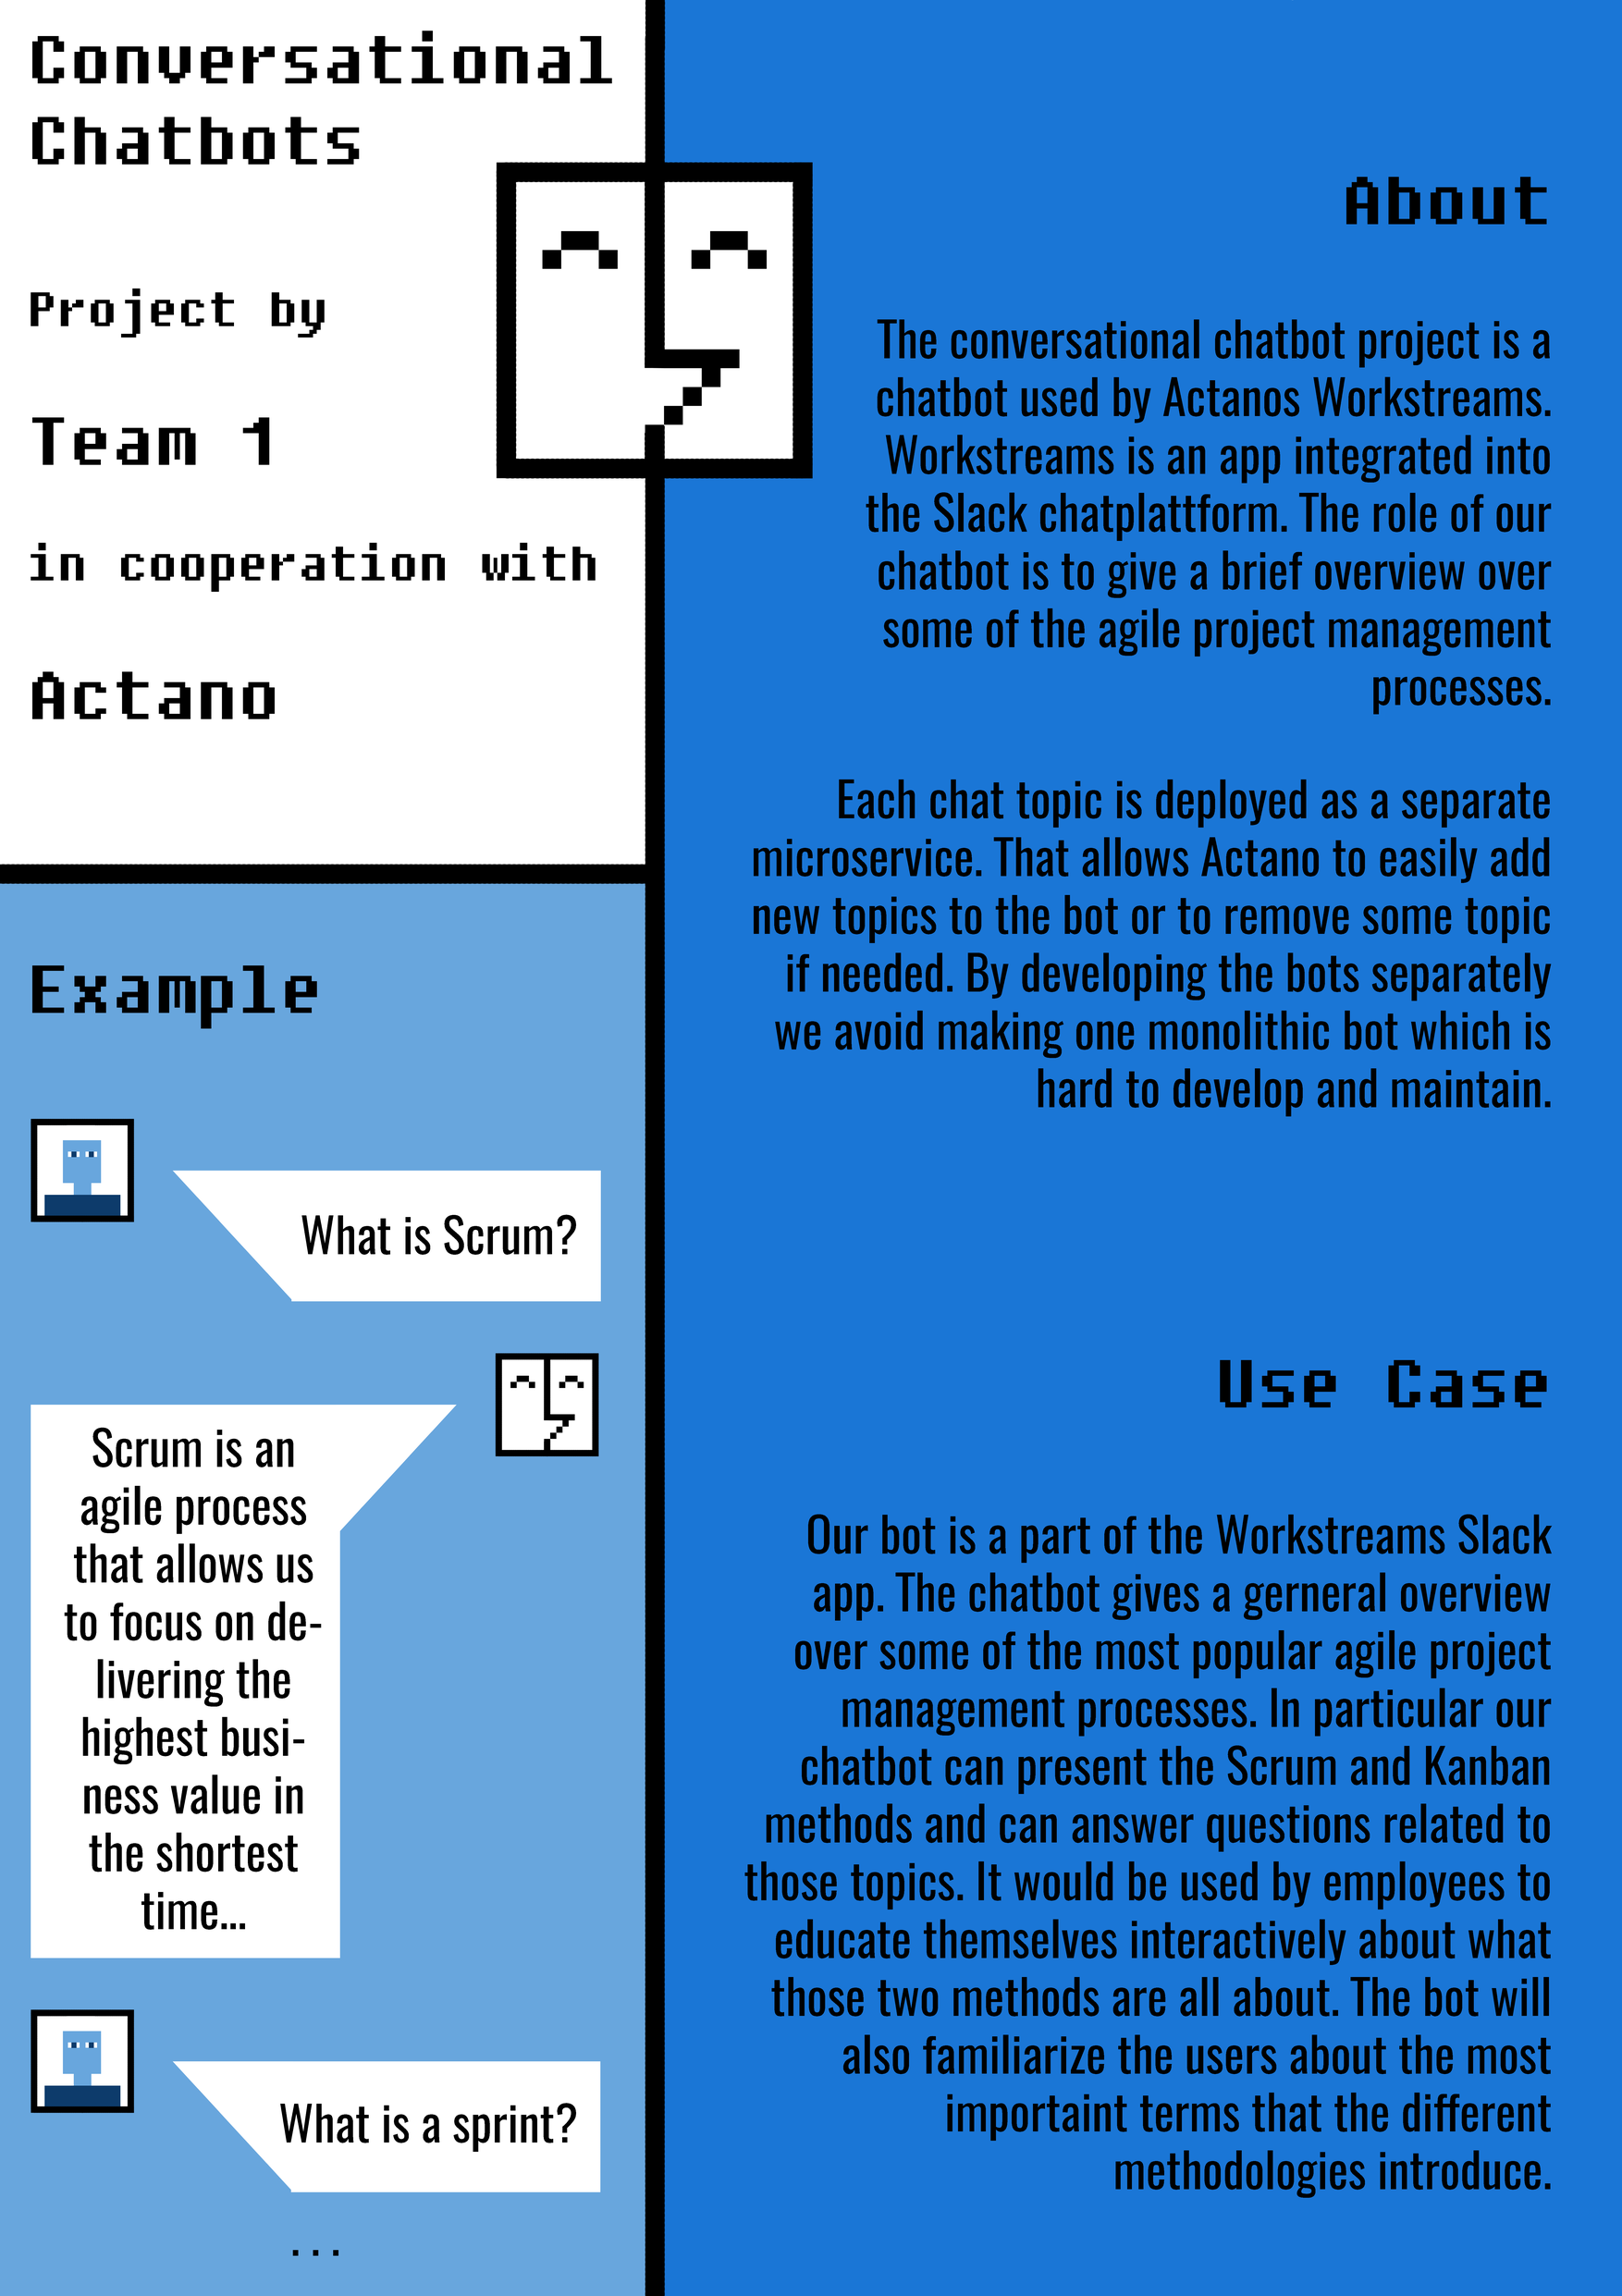 |
| Team photo | 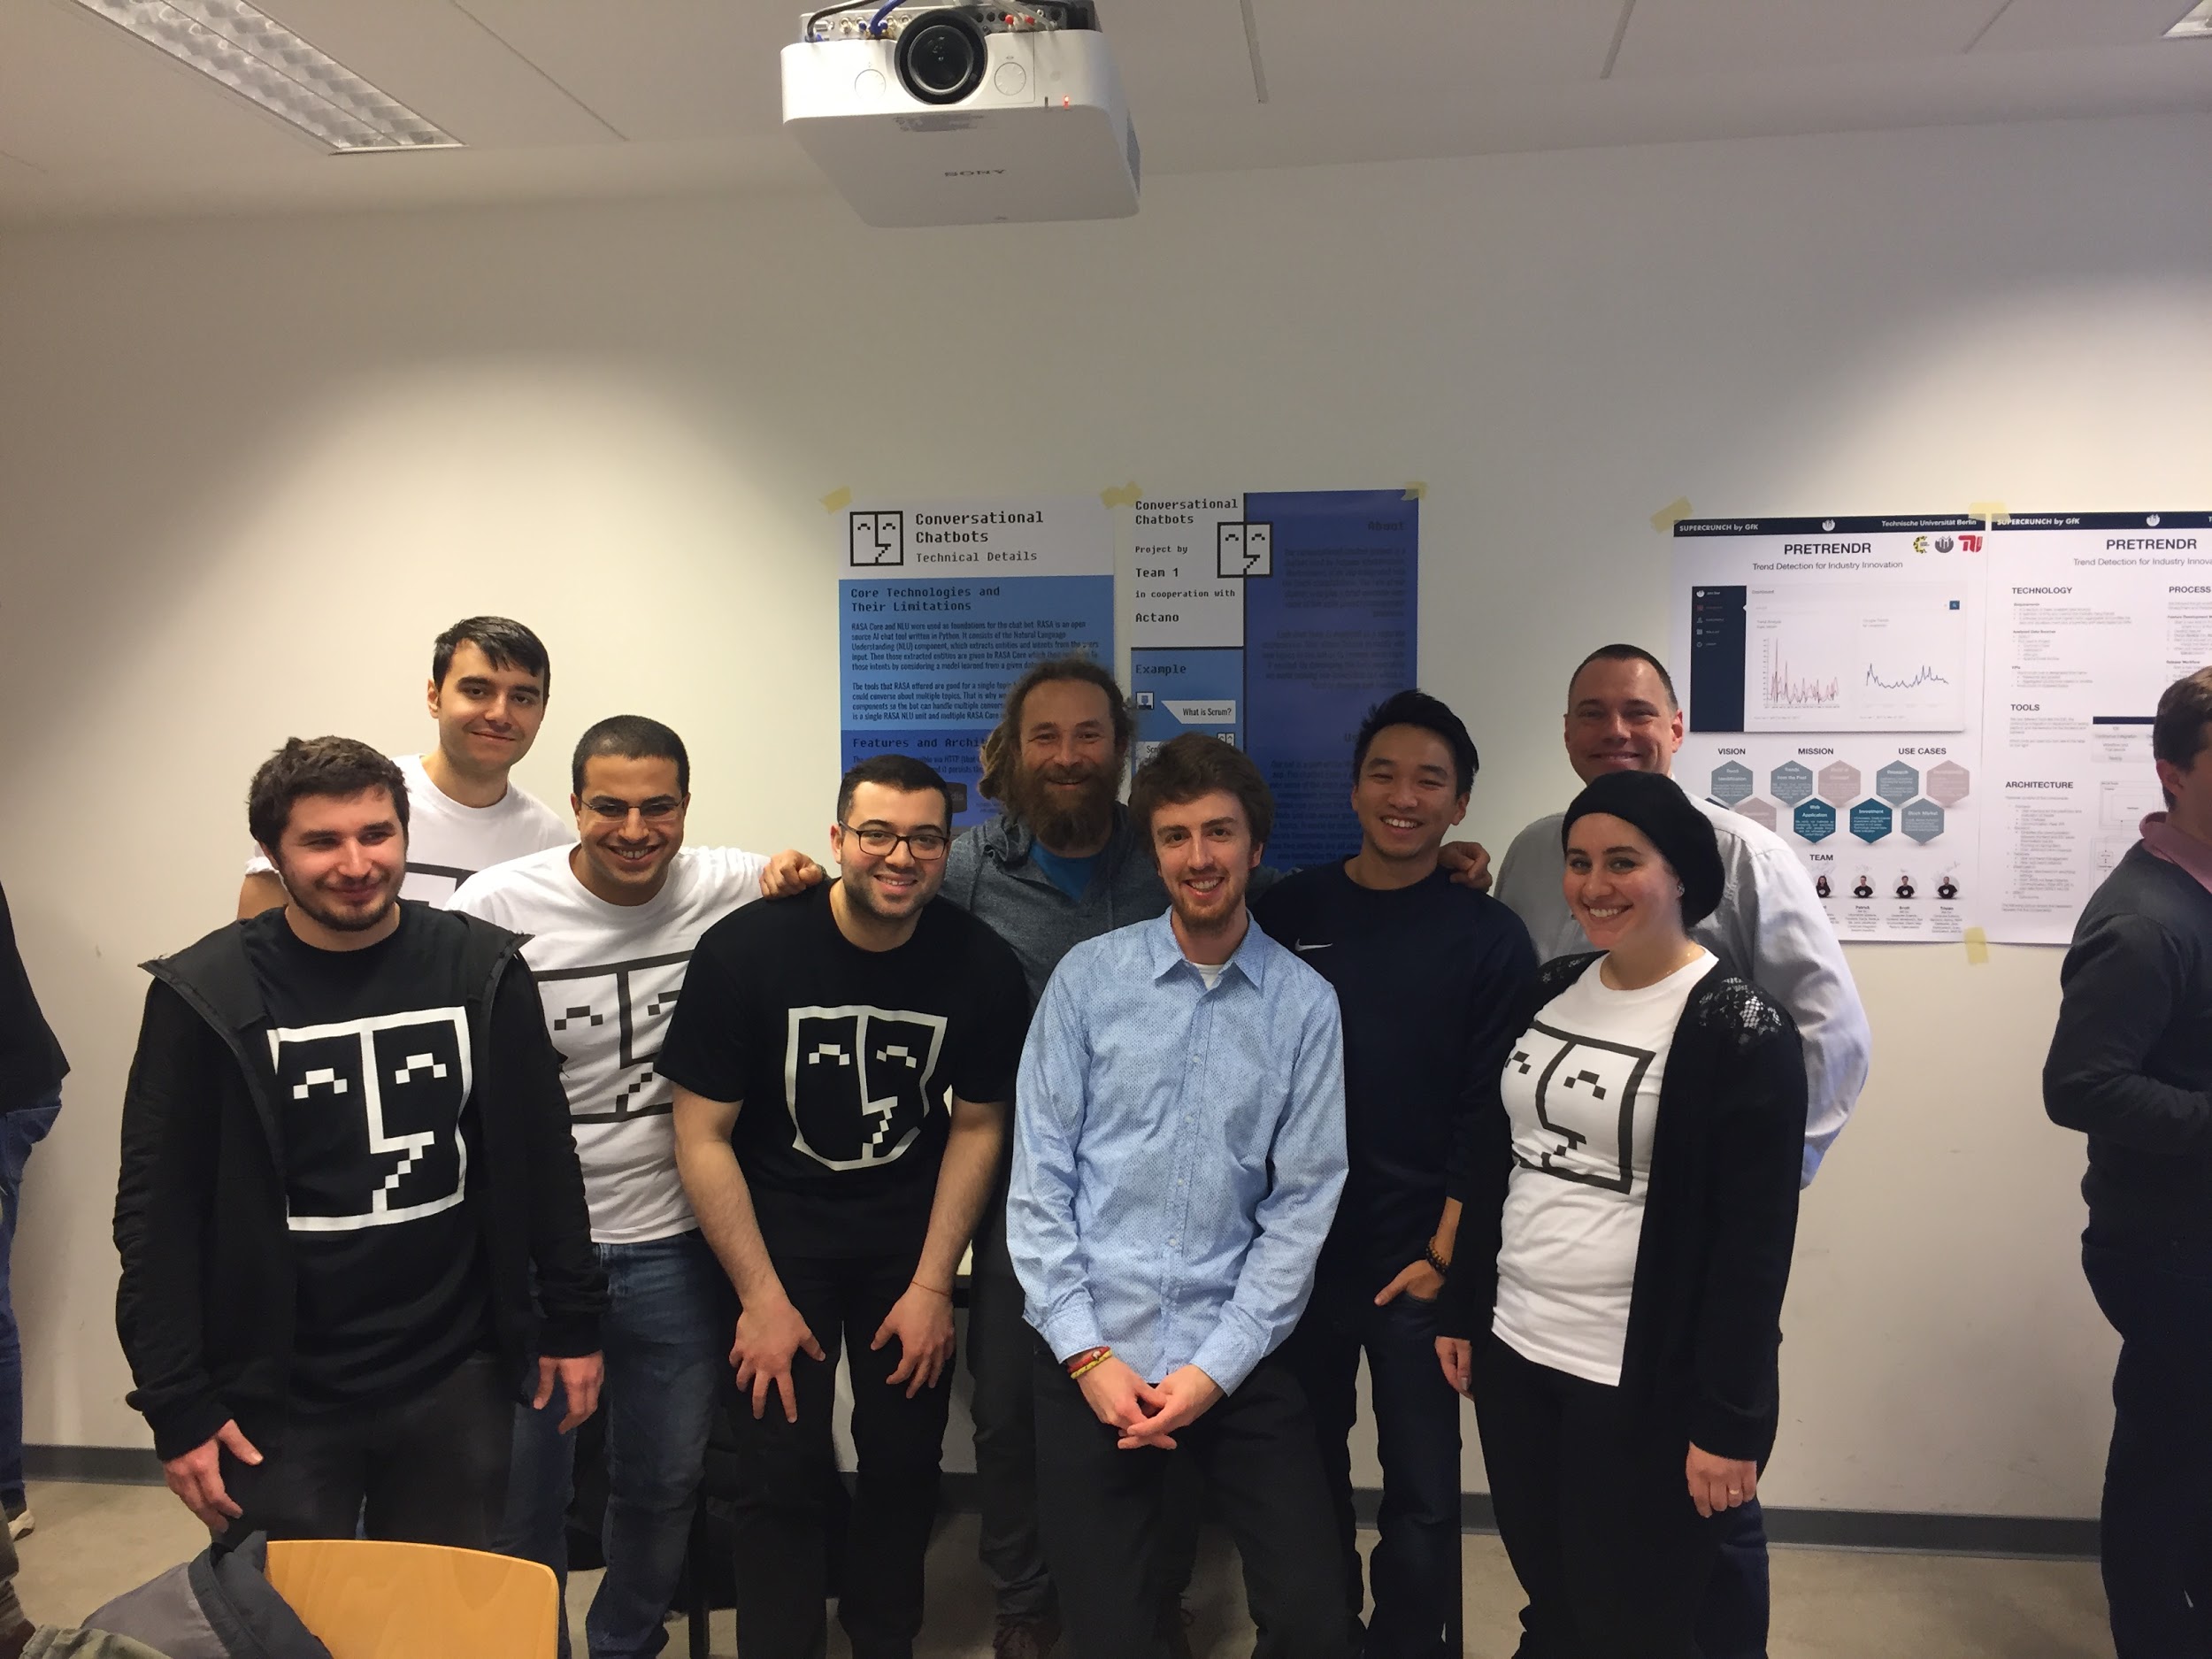 |
| Project repository | https://github.com/amos-ws17/amos-ws17-proj1 |
Side window infotainment
| Project name | Side window infotainment |
|---|---|
| Project mission | The mission of our project is to create the basis for an infotainment system inside a driving car, which provides information in a HUD about several points of interest, that can be seen through the window. In order to achieve this, the system is supposed to automatically recognize these things via a camera and/or sensors, process the information, and present them to the user. Furthermore, the user is being tracked at the same time by a second camera, to enable the user to control the system via gestures. As part of this project, a prototype will be developed, with which you can present the system on a test track to make a demo video. |
| Industry partner | IAV Engineering GmbH |
| Team logo |  |
| Project summary | SWIT is a software system for entertaining car passengers with real-time information about the current environment the vehicle is moving through. Therefore, an outdoor video stream is being made and analyzed via an offline and a cloud-based image analysis. Important sights of the city are being recognized, enriched with wiki-based information and shown to the user. The cloud-based analysis can be triggered by gestures of the user, which saves cloud requests and provides user interaction. The passenger can also rotate and change the position of GUI components by body movement. An inconvenient view angle, obstacles or knowledge lacks, the system can lead to omissions within the image analysis. To compensate these problems, the GPS position is being used to collect further points of interest of the surroundings. The found points of interest are then being rendered as objects on the screen. As the system is a prototype, a demo track can be played in for showing the functionality for simulation purposes. |
| Project illustration | 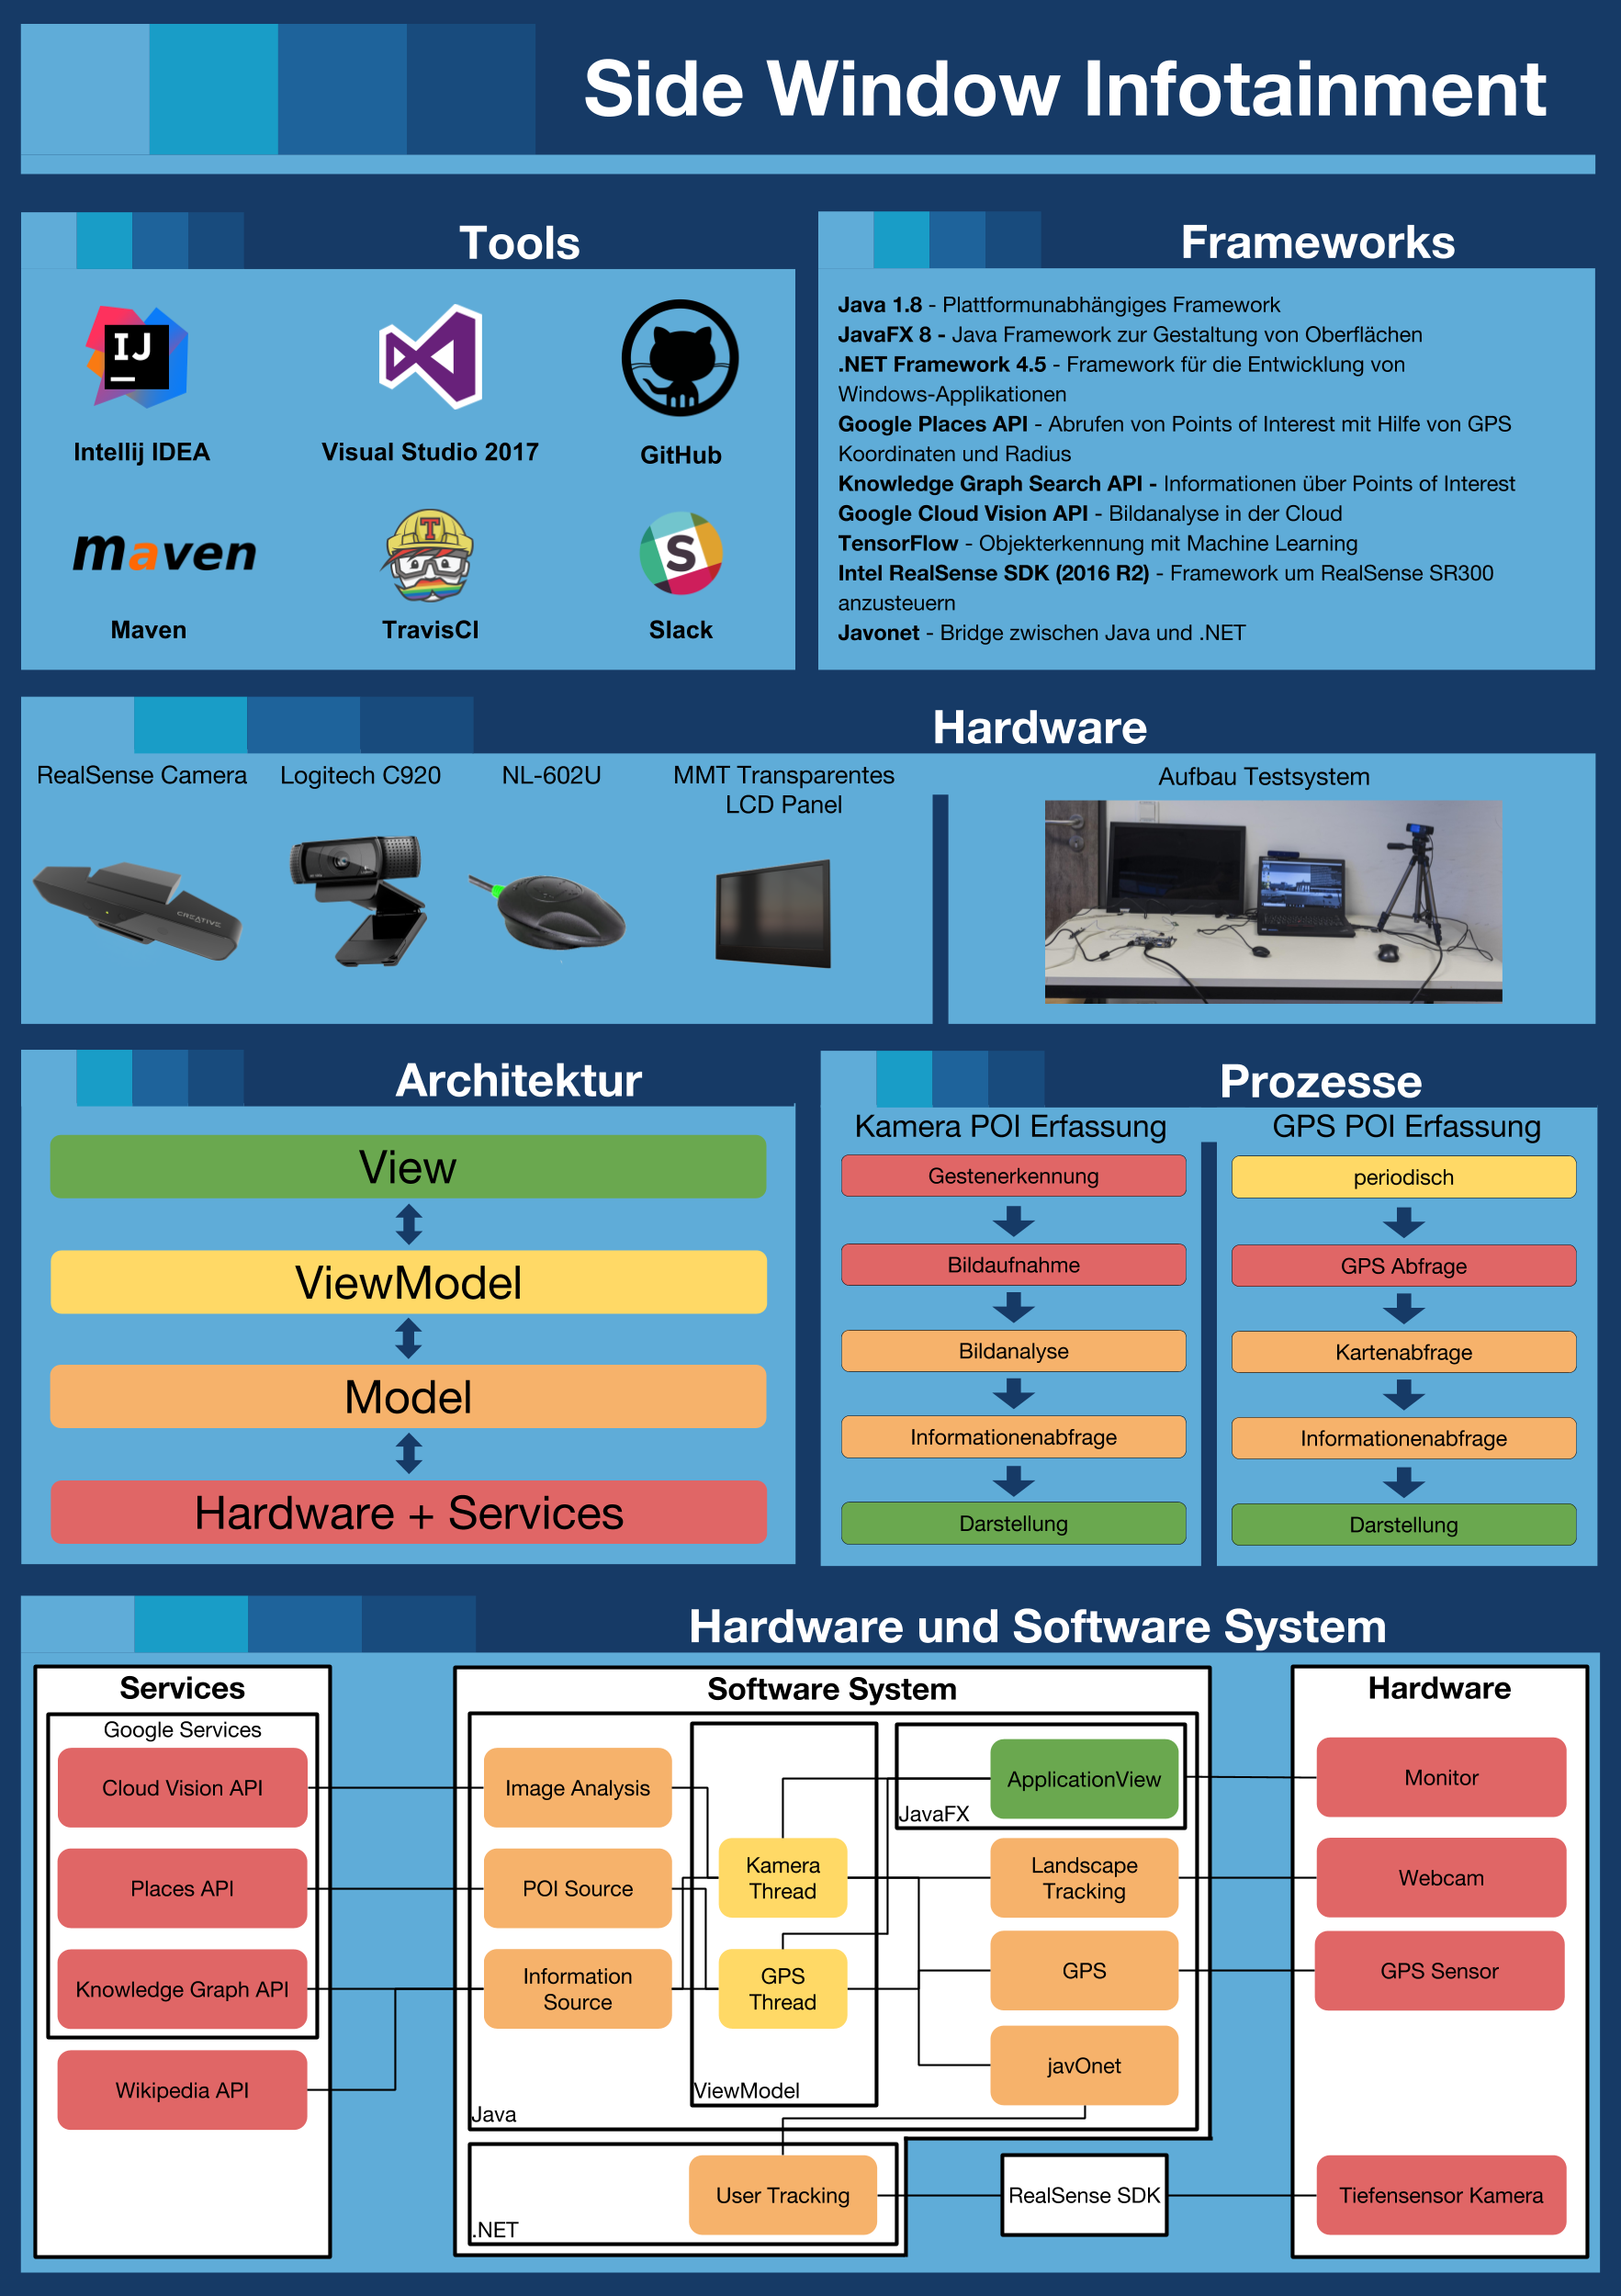 |
| Team photo |  |
| Project repository | https://github.com/cfengler/amos-ws17-proj2 |
Pretendr (big data analytics)
| Project name | Big data trend analysis and predictions |
|---|---|
| Project mission | The mission of the project is to create a proof of concept application based on existing technologies. This prototypic application should verify if existing trends could have been predicted by collecting and analyzing data sources like Gdelt, and other relevant open data sources. |
| Industry partner | Supercrunch by GfK |
| Team logo |  |
| Project summary | Pretrendr is a web application to detect and display trends. We chose the GDELT data source which is collecting news data each day from every corner of the world. We analyze the data in elasticsearch and let the user query them through our spring boot setup. This consists of a Trend Cacher, Trend Manager and Trend Executer. We have an API to our frontend, which is accessed via the pretrendr.com webpage. The web application has a landing page and a login and registration for new users. It also shows some information about the project and team members. After login the user gets to the dashboard to look for trends. It is possible to normalize trends which is useful to see correlation between several trends, with both trends being visible and normalized. For future expandatings there are some mockups linked to the dashboard. |
| Project illustration |  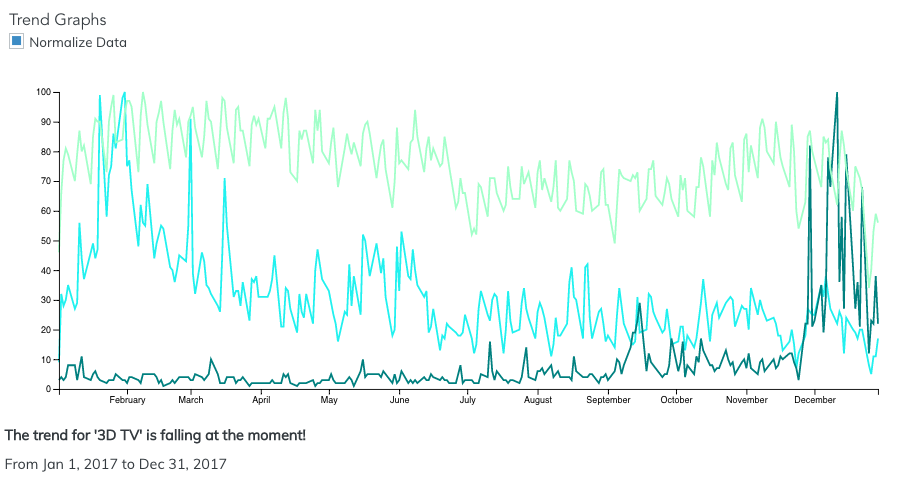 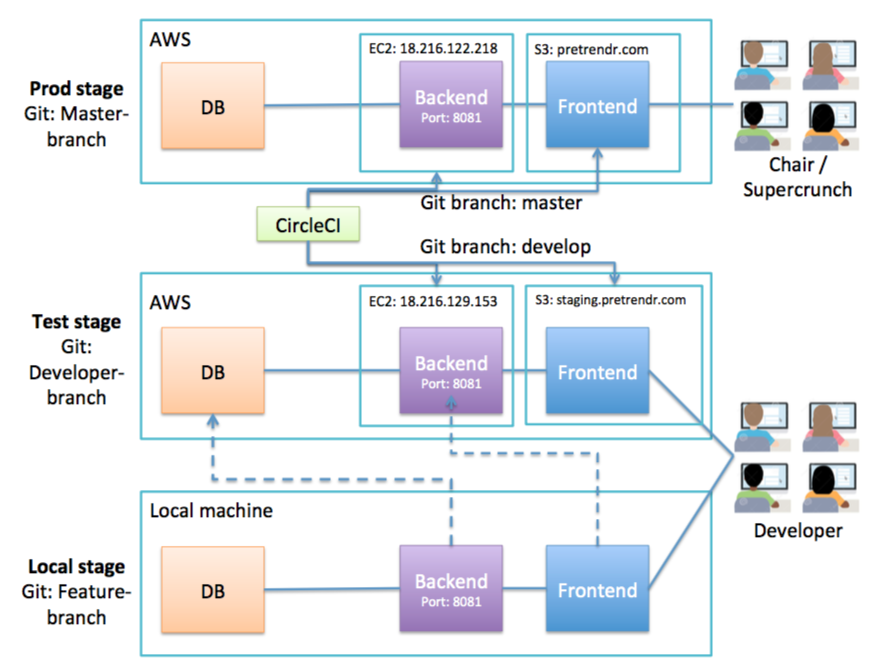 |
| Team photo | 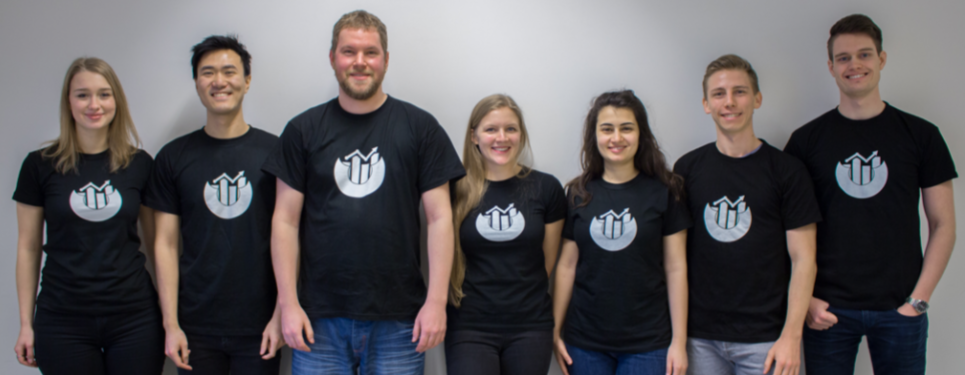 |
| Project repository | https://github.com/Astarch/amos-ws18-proj3 |


Leave a Reply