


Amit Deshpande and Dirk Riehle
SAP Research, SAP Labs LLC
Citable reference (including PDF file)
Abstract
Software development is undergoing a major change away from a fully closed software process towards a process that incorporates open source software in products and services. Just how significant is that change? To answer this question we need to look at the overall growth of open source as well as its growth rate. In this paper, we quantitatively analyze the growth of more than 5000 active and popular open source software projects. We show that the total amount of source code as well as the total number of open source projects is growing at an exponential rate. Previous research showed linear and quadratic growth in lines of source code of individual open source projects. Our work shows that open source is expanding into new domains and applications at an exponential rate.
1. Introduction
Software development is undergoing a major change from being a fully closed software development process towards a more community driven open source software development process. Successful open source projects like Linux, Apache, PostgreSQL and many others are growing super-linearly. Previous research showed that linear and quadratic growth is the dominant growth pattern of open source software projects [5] [8] [15] [16] [18] [22].
Subscribe!
In this paper, we analyze the combined growth of open source software in terms of lines of source code as well as number of projects. Our database contains more than 5000 active and popular open source projects. The database provides fine granular data of developer actions over the last 17 years from 1990 to 2006. We analyze the average amount of source code added per month for the time frame of January 1995 to December 2006 as well as the number of projects added over time.
We find that both the growth rate as well as the absolute amount of source code is best explained using an exponential model. Given that previous research showed that most open source projects grow at a polynomial rate, we suggest and then verify that the number of open source projects is growing at an exponential rate.
This paper is organized as follows. Section 2 discusses our motivation, the hypothesis, and its implications. Section 3 discusses our database and approach. Section 4 presents the results of the analysis. Section 5 discusses some limitations of the analysis and Section 6 discusses related work. Section 7 concludes the paper.
2. The Growth of Open Source
Open source software is having a major impact on the software industry and its production processes. Many software products today contain at least some open source software components. Some commercial products are completely open source software [9]. In some markets, for example, web servers, open source software holds a dominant market share [10].
Open source software today has a strong presence in industry and government. Walli et al. observe [19]: “Organizations are saving millions of dollars on IT by using open source software. In 2004, open source software saved large companies (with annual revenue of over $1 billion) an average of $3.3 million. Medium-sized companies (between $50 million and $1 billion in annual revenue) saved an average $1.1 million. Firms with revenues under $50 million saved an average $520,000.”
Commercially, the significance and growth of open source is measured in terms of revenue generated from it. Lawton and Notarfonzo state that packaged open source applications generated revenues of $1.8 billion in 2006 [9]. The software division of the Software & Information Industry Association estimates that total packaged software revenues were $235 billion in 2006 [4]. Thus, open source revenue, while still small compared to the overall market (~0.7%) is not trivial any longer.
However, open source software today is part of many proprietary (closed) source products, and measuring its growth solely by packaged software revenue is likely to underestimate its size and growth by a wide margin. To measure the growth of open source we need to look at the total growth of open source projects and their source code.
Several studies have been undertaken to measure the growth and evolution of individual open source software projects [5] [15] [16] [18]. Most of these studies are exemplary, focusing on a few selected projects only. The exception is Koch’s work, which uses a large sample (>4000 projects) to determine overall growth patterns in open source projects, concluding that polynomial growth patterns provide good models for these projects [8] [20]. Such work is mostly motivated by trying to understand how individual open source projects grow and evolve.
The work presented in this paper, in contrast, analyzes the overall growth of open source, aggregating data from more than 5000 active and popular open source projects to determine the total growth of source code and number of projects. Assuming a positive correlation between work spent on open source, its total growth in terms of code and number of projects, and the revenue generated from it, understanding the overall growth of open source will give us a better indication of how significant a role open source will play in the future.
Understanding overall open source growth helps more easily answer questions about, for example, future product structures (how much code of an application is likely to be open source code?), labor economics (how much and which open source skills does a company need?), and revenue (what percentage of the software market’s revenue will come from open source?).
The work presented in this paper shows that the total amount of open source code and the total number of projects is growing exponentially. Assuming a base of 0.7% of the market’s revenue, exponential growth is a strong indicator that open source will be of significantly increasing commercial importance. The remainder of this paper discusses our study and validates the hypothesis of exponential growth of open source.
3. Data Source and Approach
On SourceForge, the dominant open source project hosting service, there are more than 150,000 projects registered, most of which are considered inactive [1] [17]. Daffara estimates that as of today there are only about 18,000 active open source projects in the world [3].
For our analysis, we use the database of the open source analytics firm Ohloh.net, which has been crawling open source software code repositories since 2005 [11]. Our database snapshot contains 5122 active and popular open source projects written in 30 different programming languages covering 103 open source licenses. All data is updated on at least a weekly basis.
The database contains the most popular open source projects as measured by the number of in-links to their website. The in-links are provided by the Yahoo! search engine. The database contains data from January 1990 until May 2007. Of this time horizon, we analyze the time frame from January 1995 to December 2006. We omit data before 1995 because it is too sparse to be useful.
Ohloh.net provides high-level data like project structures and developer information, but also data that goes down to the level of individual developer actions. Specifically, Ohloh provides each individual commit action of all projects over their entire history to the extent that they are publicly available.
A commit is the action with which a developer contributes a piece of code to the project’s repository. A developer’s workweek typically consists of a stream of commit actions by which he or she shares the results of their work with the team, contributing to the product or project under way.
We use the amount of source code added to a project (or removed) as an approximation of the work contributed. We count code in source lines of code (SLoC), omitting empty or commented lines of code. Each commit action stored in the database lists the number of lines of code added and removed in the commit. The number of lines added or removed is calculated using the Unix diff command applied to two consecutive versions. Empty or commented lines of code are ignored. Using this data, we calculate the change in the size of a source code file by adding or subtracting the number of lines of code added to or removed from its existing size.
This data collection method gracefully handles file and directory renaming. Such renaming is modeled as if the file or directory was removed and then re-added under a new name. Both code added and code removed will have equal (large) values, so the net change is zero. This avoids any undue bias in the analysis.
Libraries are typically used across many projects. For instance, the GIMP project and the GNOME project have many libraries in common. If the lines of code for both projects were added up independently we would be double-counting the libraries, leading to skewed results. We make sure that we are not double-counting code by considering each change to the original library.
However, we cannot unambiguously identify situations where a developer adds redundant source code to the code base. Copy and paste is a common practice in software development, independently of whether it is internal, external, planned or opportunistic. To deal with this issue, we adopt two approaches.
- In the first approach we ignore the copy and paste problem and analyze the source lines of code added. The argument is that copy and paste is a reality of software development and that the copied code is part of the project. Hence, copy and paste simply needs to be accepted.
- In the second approach we find the average and the standard deviation for the code added over time. We ignore all commits where lines of code added is greater than average code added per commit plus three times the standard deviation. The heuristic’s assumption is that by not considering such large commits we ignore all commits based on copy and paste.
An analysis of average code contribution size in commits provides a cut-off value of 3060 SLoC that we use for the heuristic. This second approach is conservative in that we ignore not only copy and paste but also commits containing new code added. So we err on the lower side of total open source contributions.
We employ these two approaches to get an upper and a lower bound for the growth in source lines of code and number of projects. We can therefore say that properties like the exponential growth observed in both the upper and lower bound curve apply to the real curve as well.
4. Analysis and Results
We first analyze growth rate and total growth in open source software code and then analyze growth rate and total growth in open source software projects.
4.1 Growth in source code
Figures 1 and 2 show plots that represent the growth in source lines of code added using Approach 1 and 2 respectively. The Y-axis shows the number of lines of code added each month and the X-axis shows the time. Each data point on the plot represents the total number of lines of code added during that month. The time frame is 1995 through 2006 for all projects. We can see an upward trend in the amount of code added over time. Both Approach 1 and 2 show a similar pattern of growth.
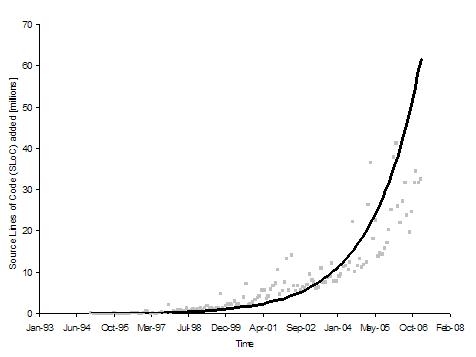
Figure 1: Graph of source lines of code added [millions] (Approach 1)
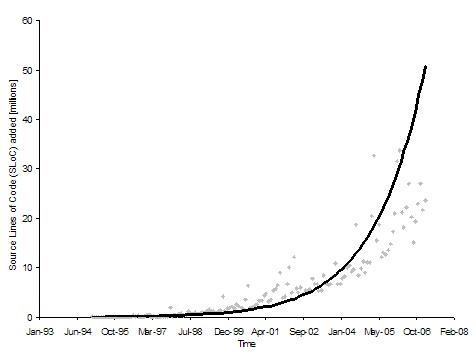
Figure 2: Graph of source lines of code added [millions] (Approach 2)
Table 1 shows models for the two plots. In both cases, the best fitting model is an exponential curve with an R-square value of about 0.9, giving us confidence in the validity of the claim that the amount of code added is growing exponentially.
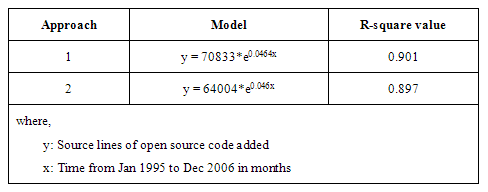
Table 1: Model of source lines of code added
Figure 3 shows the total number of lines of open source code over time. Table 2 shows the statistical models for the two approaches. The doubling time for Approach 1 is 12.5 months, and the doubling time for Approach 2 is 14.9 months. We observe that the total code in Approach 2 is lower than in Approach 1 but follows a similar trend. This behavior is expected as we eliminated all large commits in the second approach to exclude copy and paste contributions.
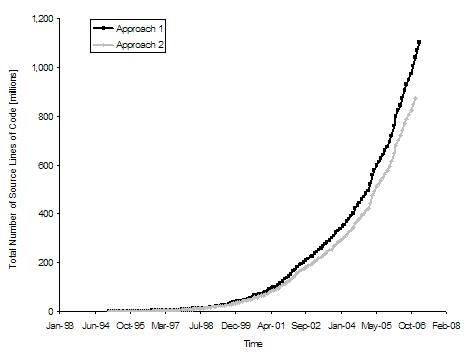
Figure 3: Graph of total source lines of code [millions] (both approaches)
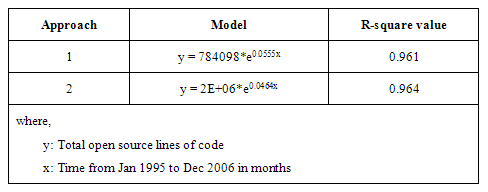
Table 2: Model of total source lines of code
4.2 Growth in projects
Figure 4 shows the number of projects added over time and Table 3 shows the model and its fit with the data. For each project, there is a first occurrence of a project action (for example, the initial commit action), and that point of time is considered the birth date of the project. This is the point of time when the project is counted as added to the overall set of projects.
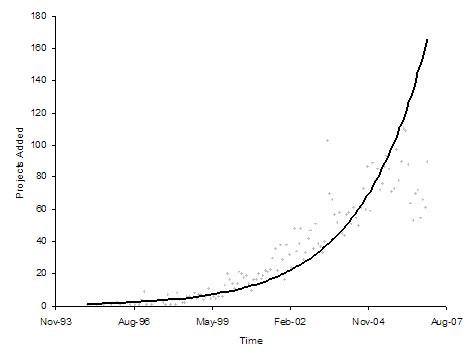
Figure 4: Graph of number of open source projects added
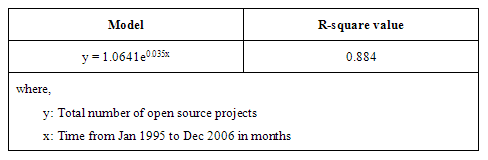
Table 3: Model of number of open source projects added
Large distributions like Debian are counted as one project. Popular projects such as GNU Emacs are counted as projects of their own, little known or obsolete packages such as the Zoo archive utility are ignored. Many of the projects that were included in a Debian distribution around 1998 are not popular enough today (as stand-alone projects) to be included in our copy of the Ohloh database.
And again, we get the best fit for the resulting curve for an exponential model with an R-square value of 0.88.
Figure 5 then shows the total number of projects and Table 4 shows the corresponding model and its fit with the data. Again, we get the best fit for an exponential model with an R-square value of 0.96. The doubling time is 13.9 months.
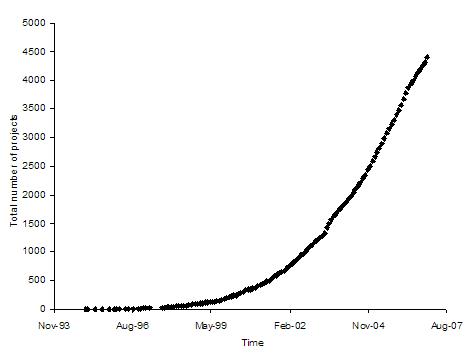
Figure 5: Graph of total number of open source projects
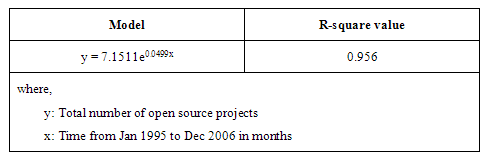
Table 4: Model of total number of open source projects
4.3 Review of findings
This section shows the growth of source code in open source projects as well as the growth of open source projects itself. We consistently get the best fit for the data using exponential models. The doubling time based on the exponential models is about 14 months for both the total amount of source code and the total number of projects. It should be noted that if we were to break up the data sets into separate time periods, we might find better fits for other models than the exponential model. In future work we will analyze the overall growth in distinct phases, each of which is best explained by a separate growth model.
In [13] we discuss the size and frequency of code contributions to open source projects. We can use those results to further increase our confidence in the results presented above. Specifically, the lines of code added can be assumed equal to the product of the average size of a commit in terms of source lines of code and the commit frequency. Our analysis shows that the average commit size is almost constant while the commit frequency (number of commits per week) increases exponentially between Jan 1995 to Dec 2006. This verifies our findings about the exponential growth in open source.
5. Limitations of Analysis
The quantitative analysis and the conclusions we draw have the following shortcomings and limitations.
- Sample size. We considered 5122 active and popular open source projects. The total number of open source projects in the world is much larger. However, Daffara estimates that of the total number only 18,000 projects (lower bound) are actually active [3]. So we believe that the sample we are using is relevant for analyzing trends and patterns in open source growth.
- Data incompleteness. Some amount of revision control information in open source projects has already been lost forever, as projects have moved on from no configuration management (CM) to CM with CVS and on to other CM tools, frequently dropping the history with each move. Thus, the project history for each project is not always complete. However, for a current project, we have the most recent history, which is what is most relevant for our analysis. Thus, the lack of some of the early histories of some of the open source projects has little effect on the validity of our conclusions.
- Project source. A current limitation of Ohloh is that it only connects to CVS, Subversion and Git source code repositories. We believe that this limitation is not a big issue for our purposes because almost all open source projects are maintained in one of these repositories and our sample size can be considered representative.
- Copy and paste. Our approach to eliminating copy and paste issues (Approach 2) is limited in its effectiveness: The filter excludes a lot of good values while still allowing minor copy and paste to pass. For the purposes of our analysis, however, it is not a major issue, because we are interested in the overall trend, and even the conservative Approach 2 still validates our hypothesis of exponential growth.
We are continuing our work to iron out possible pitfalls based on these limitations. However, we believe that while the respective critiques can be made, the effects are rather limited, as argued above in each case.
6. Related Work
Several studies of the evolution of open source projects have been undertaken.
- González-Barahona et al. estimated the lines of code in the Debian 2.0 release and concluded that the system represents an effort of more than 14,000 person-years, which translates to about 2 billion USD [6].
- Succi et al. showed a linear growth rate for the GCC and Apache projects. They also showed that Linux has super linear growth [18]. They found that Linux (in 2000) violates Lehman’s fourth law of software evolution.
- In contrast to this, Roy and Cordy examined the evolution of the Barcode Library and the zlib project and showed that these two smaller projects follow Lehman’s laws of software evolution [16].
- Godfrey and Tu showed a super-linear increase in source lines of code over time in the Linux kernel and the VIM text editor [5].
- Robles et al. confirmed that the Linux kernel is growing super-linearly [15]. The NetBSD, FreeBSD, OpenBSD (until 2001) and 18 other projects showed an almost linear growth pattern.
- Koch’s study of 4047 open source projects on SourceForge indicates that a quadratic growth model fits the growth of an individual project better than a linear growth model [8] [20].
- Scacchi reviews prior results on open source evolution, suggesting that the growth patterns for large open source projects are not representative for all of open source [22]. His discussion of the evolution of open source software suggests that Lehman’s laws of software evolution based on closed-source systems do not apply to open source, and that further study is needed.
Most of the research listed above explores the evolution of individual projects. The growth models of projects are typically linear or quadratic. None of the related work quantitatively analyzes the total growth of open source software.
Our analysis does not focus on any particular project but on the general trend in open source software. The projects considered are independent of any particular license, language, topic or size.
7. Conclusion
The significance of open source has been continuously increasing over time. Our research validates this claim by looking at the total growth of open source. Our work shows that the additions to open source projects, the total project size (measured in source lines of code), the number of new open source projects, and the total number of open source projects are growing at an exponential rate. The total amount of source code and the total number of projects double about every 14 months.
Our results open gates for further research around the growth of open source and the acceptance of open source in industry and government. Future research should explore questions like what factors are influencing this exponential growth, how source code growth relates to the number of engaged software developers, and whether or how long open source can sustain this exponential growth.
Acknowledgments
We would like to thank Prem Devanbu and Gregorio Robles for their feedback on earlier versions of the paper as well as their encouragement for the work presented. We also would like to thank Oliver Arafat and Mario Fernandez for proofreading the paper.
References
[1] Comino, S, Manenti, F.M., Parisi, M. L. From Planning to Mature: On the Determinants of Open Source Take Off. Department of Economics Working Papers 0517, Department of Economics, University of Trento, Italia. 2005.
[2] Crowston, K. and Scozzi, B. Open Source Software Projects as Virtual Organizations: Competency Rallying for Software Development. IEE Proceedings—Software Engineering, vol. 149, no. 1, 2002: 3-17.
[3] Daffara, C. How Many Stable and Active Libre Software Projects? Retrieved on Sept 13, 2007, from http://flossmetrics.org/news/11.
[4] Software & Information Industry Association. Packaged Software Industry Revenue and Growth, 2006. Available from http://siia.net/software/
[5] Godfrey, M., Tu, M. Growth, Evolution, and Structural Change in Open Source Software. In Proceedings of the 4th International Workshop on Principles of Software Evolution. ACM Press, 2001: 103-106.
[6] González-Barahona, J., Ortuño Pérez, M., de las Heras Quirós, P., Centeno González, J., Matellán Olivera, V. Counting potatoes: The Size of Debian 2.2. Retrieved on Sept 13, 2007, from http://people.debian.org/~jgb/debian-counting/counting-potatoes/.
[7] Haruvy, E., Wu F. and Chakravarty S. Incentives for Developers’ Contributions and Product Performance Metric in Open Source Development: An Empirical Exploration. University of Texas Working Paper.
[8] Koch, S. Evolution of Open Source Software Systems—A Large-Scale Investigation. In Proceedings of the 1st International Conference on Open Source Systems (OSS 2005).
[9] Lawton, M., Notarfonzo, R. Worldwide Open Source Software Business Models 2007–2011 Forecast: A Preliminary View. IDC Inc.
[10] Netcraft. Netcraft Web Server Survey. Netcraft, 2007. Retrieved on Sept 13, 2007, from http://survey.netcraft.com/Reports/200708/byserver/.
[11] Ohloh Corporation. See http://www.ohloh.net.
[12] Raymond, E. S. The Cathedral and the Bazaar. O’Reilly & Associates, 1999.
[13] Deshpande, A. Riehle, D. Continuous Integration in Open Source Software Projects. Submitted to the 4th International Conference on Open Source Systems (OSS 2008).
[14] Robles, G., Gonzalez-Barahona, J. M., Michlmayr, M., and Amor, J. J. Mining Large Software Compilations Over Time: Another Perspective of Software Evolution. In Proceedings of the 2006 International Workshop on Mining Software Repositories (MSR 2006). ACM Press, 2006: 3-9.
[15] Robles, G., Amor, J. J., Gonzalez-Barahona, J. M., and Herraiz, I. Evolution and Growth in Large Libre Software Projects. In Proceedings of the Eighth International Workshop on Principles of Software Evolution (IWPSE 2005). IEEE Computer Society, 2005: 165-174.
[16] Roy, C. K. and Cordy, J. R. Evaluating the Evolution of Small Scale Open Source Software Systems. See http://citeseer.ist.psu.edu/761885.html.
[17] SourceForge. See http://www.sourceforge.net.
[18] Succi, G., Paulson, J., Eberlein, A. Preliminary Results From an Empirical Study on the Growth of Open Source and Commercial Software Products. In EDSER-3 Workshop (2001): 14-15.
[19] Walli, S., Gynn, D., Rotz, B. V. The Growth of Open Source Software in Organizations: A Report. Retrieved on Sept 13, 2007, from http://optaros.com/en/publications/white_papers_reports/the_growth_of_open_source_software_in_organizations. (Local copy.)
[20] Koch, S. Software Evolution in Open Source Projects—A Large-Scale Investigation. In Journal of Software Maintenance and Evolution: Research and Practice 2007; 19: 361-382.
[21] Karim, R., Lakhani, R.G. Wolf. Why Hackers Do What They Do: Understanding Motivation and Effort in Free/Open Source Software Projects. In Perspectives on Free and Open Source Software. MIT Press, 2005: 3-22.
[22] Walt Scacchi. Understanding Open Source Software Evolution. In Software Evolution and Feedback. John Wiley & Sons, 2006.
Leave a Reply