Dirk Riehle's Industry and Research Publications

Addendum to Total Growth of Open Source Paper

Based on multiple requests, for the Total Growth of Open Source paper, we are providing a table of doubling times for the exponential models as well as semi-log scale graphs of the growth curves.

total-growth-doubling-times.png

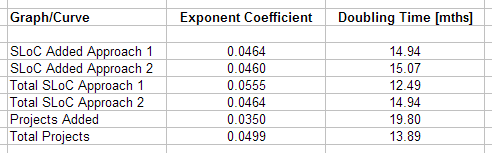
Table 1: Doubling times for the growth curves

total-growth-log-scale-1.png

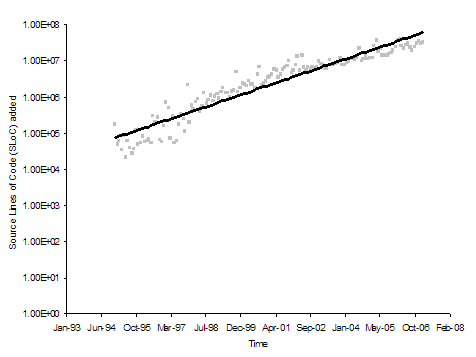
Figure 1: Semi-log scale graph of source lines of code added (Approach 1)

total-growth-log-scale-2.png

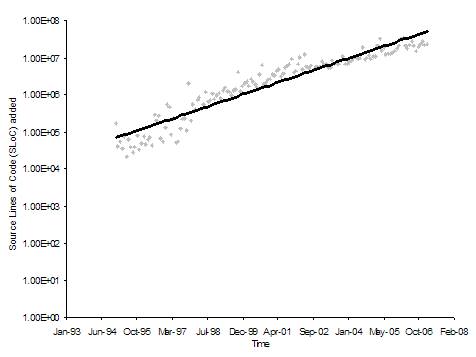
Figure 2: Semi-log scale graph of source lines of code added (Approach 2)

total-growth-log-scale-3.png

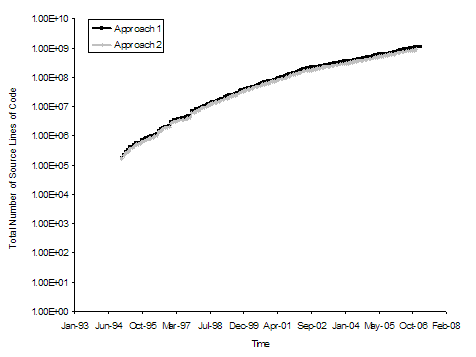
Figure 3: Semi-log scale graph of total source lines of code (both approaches)

total-growth-log-scale-4.png

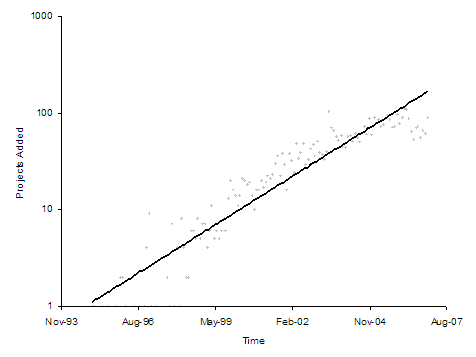
Figure 4: Semi-log scale graph of number of open source projects added

total-growth-log-scale-5.png

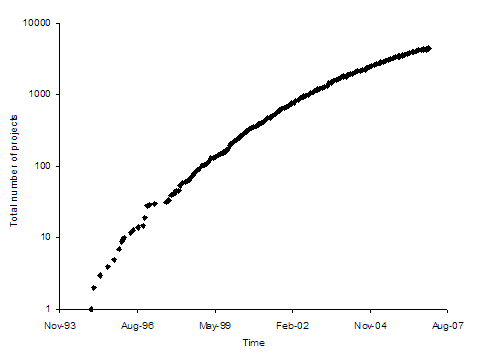
Figure 5: Semi-log scale graph of total number of open source projects

Subscribe!

Comments

Leave a Reply

This site uses Akismet to reduce spam. Learn how your comment data is processed.

  1. […] grafische Darstellung der Messwerte zeigt eine erhebliche Streuung, und in der halblogarithmischen Darstellung erkennt man, dass statt einer lineare Steigung (=exponentielles Wachstum) eine Kurve eher eine […]

Navigation

Share the content

Share on LinkedIn

Share by email

Share on X (Twitter)

Share on WhatsApp

Featured startups

QDAcity makes collaborative qualitative data analysis fun and easy.

Featured projects

Open data, easy and social
Engineering intelligence unleashed
Open source, safe and easy