Dirk Riehle's Industry and Research Publications

Addendum to Total Growth of Open Source Paper

Based on multiple requests, for the Total Growth of Open Source paper, we are providing a table of doubling times for the exponential models as well as semi-log scale graphs of the growth curves.

total-growth-doubling-times.png

Table 1: Doubling times for the growth curves
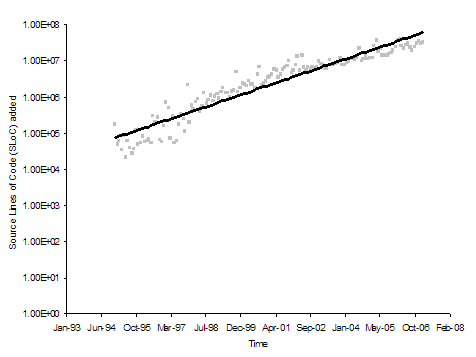
total-growth-log-scale-1.png

Figure 1: Semi-log scale graph of source lines of code added (Approach 1)
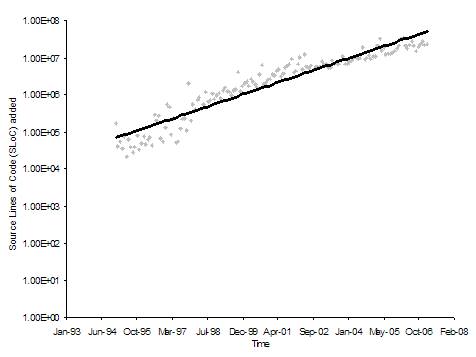
total-growth-log-scale-2.png

Figure 2: Semi-log scale graph of source lines of code added (Approach 2)
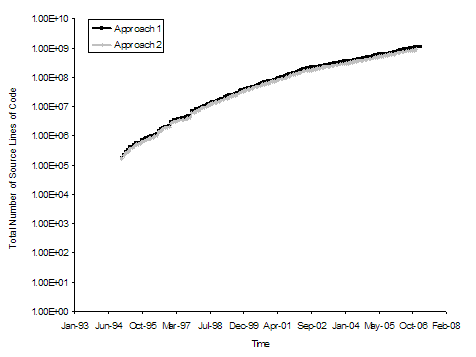
total-growth-log-scale-3.png

Figure 3: Semi-log scale graph of total source lines of code (both approaches)
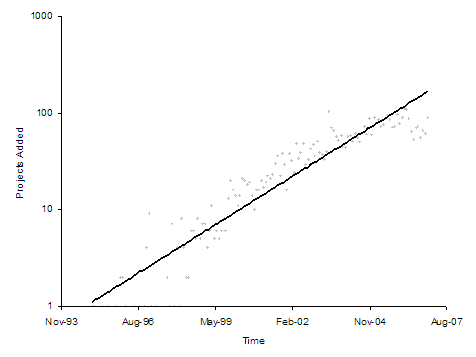
total-growth-log-scale-4.png

Figure 4: Semi-log scale graph of number of open source projects added
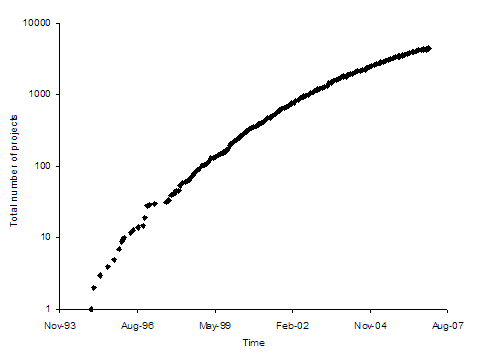
total-growth-log-scale-5.png

Figure 5: Semi-log scale graph of total number of open source projects

Subscribe!

Comments

Leave a Reply

This site uses Akismet to reduce spam. Learn how your comment data is processed.

  1. […] grafische Darstellung der Messwerte zeigt eine erhebliche Streuung, und in der halblogarithmischen Darstellung erkennt man, dass statt einer lineare Steigung (=exponentielles Wachstum) eine Kurve eher eine […]

Navigation

Share the content

Share on LinkedIn

Share by email

Share on X (Twitter)

Share on WhatsApp

Featured startups

QDAcity makes collaborative qualitative data analysis fun and easy.

Featured projects

Open data, easy and social
Engineering intelligence unleashed
Open source in products, easy and safe