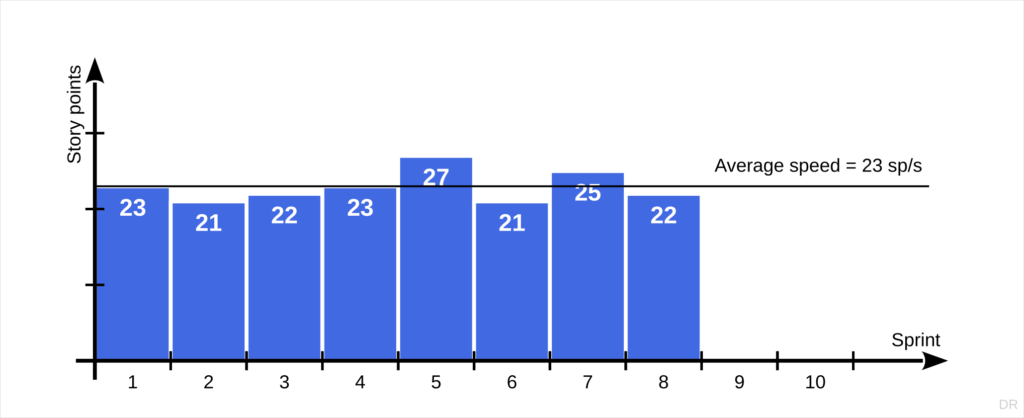
In Scrum, velocity charts display the story points achieved in a given sprint, and a burndown chart displays the total size of features you expect to deliver in future sprints until the end of the project release cycle, typically with the goal of reaching zero remaining features to be done.


I teach Scrum at German universities, because it lets us engage with industry, and because the bureaucracy of Scrum provides a good process skeleton to hang on to and avoid that student teams descend into chaos. In the AMOS project, teams of size 6-9 students develop open-source software based on industry partner requirements.
One recent development was the addition of a separate agile coach course, in which returning students get to play the Scrum Master for a student team. The COACH course is led by an experienced industry coach, Giovanna Luisi, and we recently discovered some discrepancy in how we thought velocity and burndown charts are or should be used.
For Giovanna, velocity and burndown charts are metrics, to be used by Scrum Masters in assessing team performance and helping process improvement. For me, velocity and burndown charts are planning tools, to be created and used by product owners, for planning purposes.
I suspect it doesn’t matter much who creates them, as long as they are properly created, and everyone can satisfy their use-case with it. What is critical though is that the use-cases are understood well: Specifically, a product owner is not a project manager and should not be using these tools to manage the software developers. If they did, the collaborative nature of the overall team would go out the window, creating confrontation and ultimately reducing velocity.


Leave a Reply